Table of Contents Back Previous Next Logo

Working with Graphs > Working with Your Graph
Working with Your Graph
This section explains some of the ways you can put your graph to use once you've created it. This section includes:
Printing Your Graph
To print your graph:
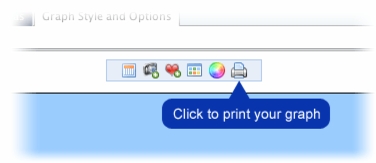
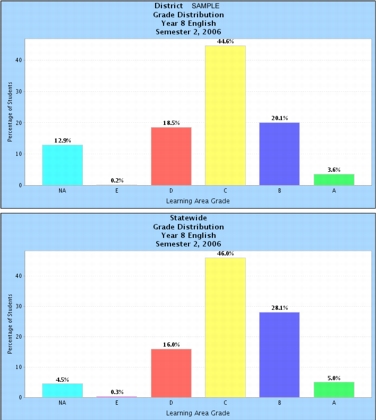
Your graph is displayed in isolation, in a new browser window or tab. You can now use your browser's print options (File > Print) to print your graph.
Depending on the size of your graph, and your printer's capabilities, it may be necessary to print the graph in landscape orientation to avoid cropping part of the graph.
To print landscape in Microsoft Internet Explorer or Firefox, select File > Page Setup and click Landscape in the Orientation or Format area.
Using Your Graph in Documents and Presentations
You can copy and paste the graph image into applications like Word or PowerPoint to create reports or presentations.
To use your graph in MS Office applications:
Select Edit > Paste Special.
The Paste Special dialogue box is displayed.
Select Device Independent Bitmap from the As list.
The graph image is displayed in your document.
Displaying the Graph Data
You can choose to display a summary of the graph's data in a table underneath the graph image.
To display the graph's data:
Click the data table icon on the toolbar immediately above your graph.
The graph's data table is displayed below the graph.
Tiling Graphs
The Tiling feature enables you to split graph data (which is by default displayed on a single graph) onto multiple graphs.
For example, if you define a graph with two or more groups (i.e. a prime group and one or more comparative groups), the default graph will include all of the data on a single graph. Tiling the graph will split the group data on to separate graphs.
You can tile graphs that contain the following data types:
To tile a graph:
Define and build a graph that contains either two groups or two learning areas. The following example contains data for a District and the State (for comparison).
The screen is refreshed and the graph data is split across multiple graphs.

Table of Contents Back Previous Next
http://www.eddept.wa.edu.au
Tel: (08) 9264 4111
(08) 9264 5005
websupport@det.wa.edu.au